巴特沃斯滤波器是信号处理中常用的一种滤波器,其最大的特点是计算量小、频响曲线平滑,非常适合对一维信号进行各种滤波预处理。本文提供了一个对 Python scipy.signal 中 Butterworth 滤波器的很简单的封装,接口更加易用,笔者在最近的几个项目中都使用了这个滤波器实现。它具有以下特性:
- 支持低通、带通、高通滤波模式,可指定滤波器阶数。
- 可以批量处理任意形状的一维数据(任意形状的张量,指定滤波维度)
代码
1
2
3
4
5
6
7
8
9
10
11
12
13
14
15
16
17
18
19
20
21
22
23
24
25
26
27
28
29
30
31
32
33
34
35
36
37
38
# filter.py
import numpy as np
from scipy import signal
from typing import Union, Tuple


class Butterworth:


    def __init__(self, fs:float, cut:Union[float,Tuple[float,float]],
            mode:str='lowpass', order:int=4) -> None:
        ''' Init the parameters of the Butterworth filter.
        args:
            fs: float, the sampling frequency in Hz.
            cut: Union[float,Tuple[float,float]], the cut-off frequencies of the
                transition band. Use low and high cut-off frequencies or both of
                them depending on the filter mode.
            mode: str, in {'lowpass', 'highpass', 'bandpass', 'bandstop'}.
                Default is 'lowpass'.
            order: int, the order of the Butterworth filter.
        '''
        nyq = 0.5 * fs
        if mode == 'lowpass' or mode == 'highpass':
            self.sos = signal.butter(order, cut/nyq, btype=mode, output='sos')
        elif mode == 'bandpass' or mode == 'bandstop':
            self.sos = signal.butter(order, [cut[0]/nyq, cut[1]/nyq], btype=mode, output='sos')
        else: raise Exception(f'Wrong filter mode: {mode}.')


    def filt(self, data:np.ndarray, axis:int=-1) -> np.ndarray:
        ''' Filter signals.
        args:
            data: np.ndarray, of any shape and any dtype.
            axis: int, the axis to perform 1d filtering. Default is -1.
        returns:
            np.ndarray, with the same shape as data, the filtered signals.
        '''
        return signal.sosfiltfilt(self.sos, data, axis=axis)
使用样例
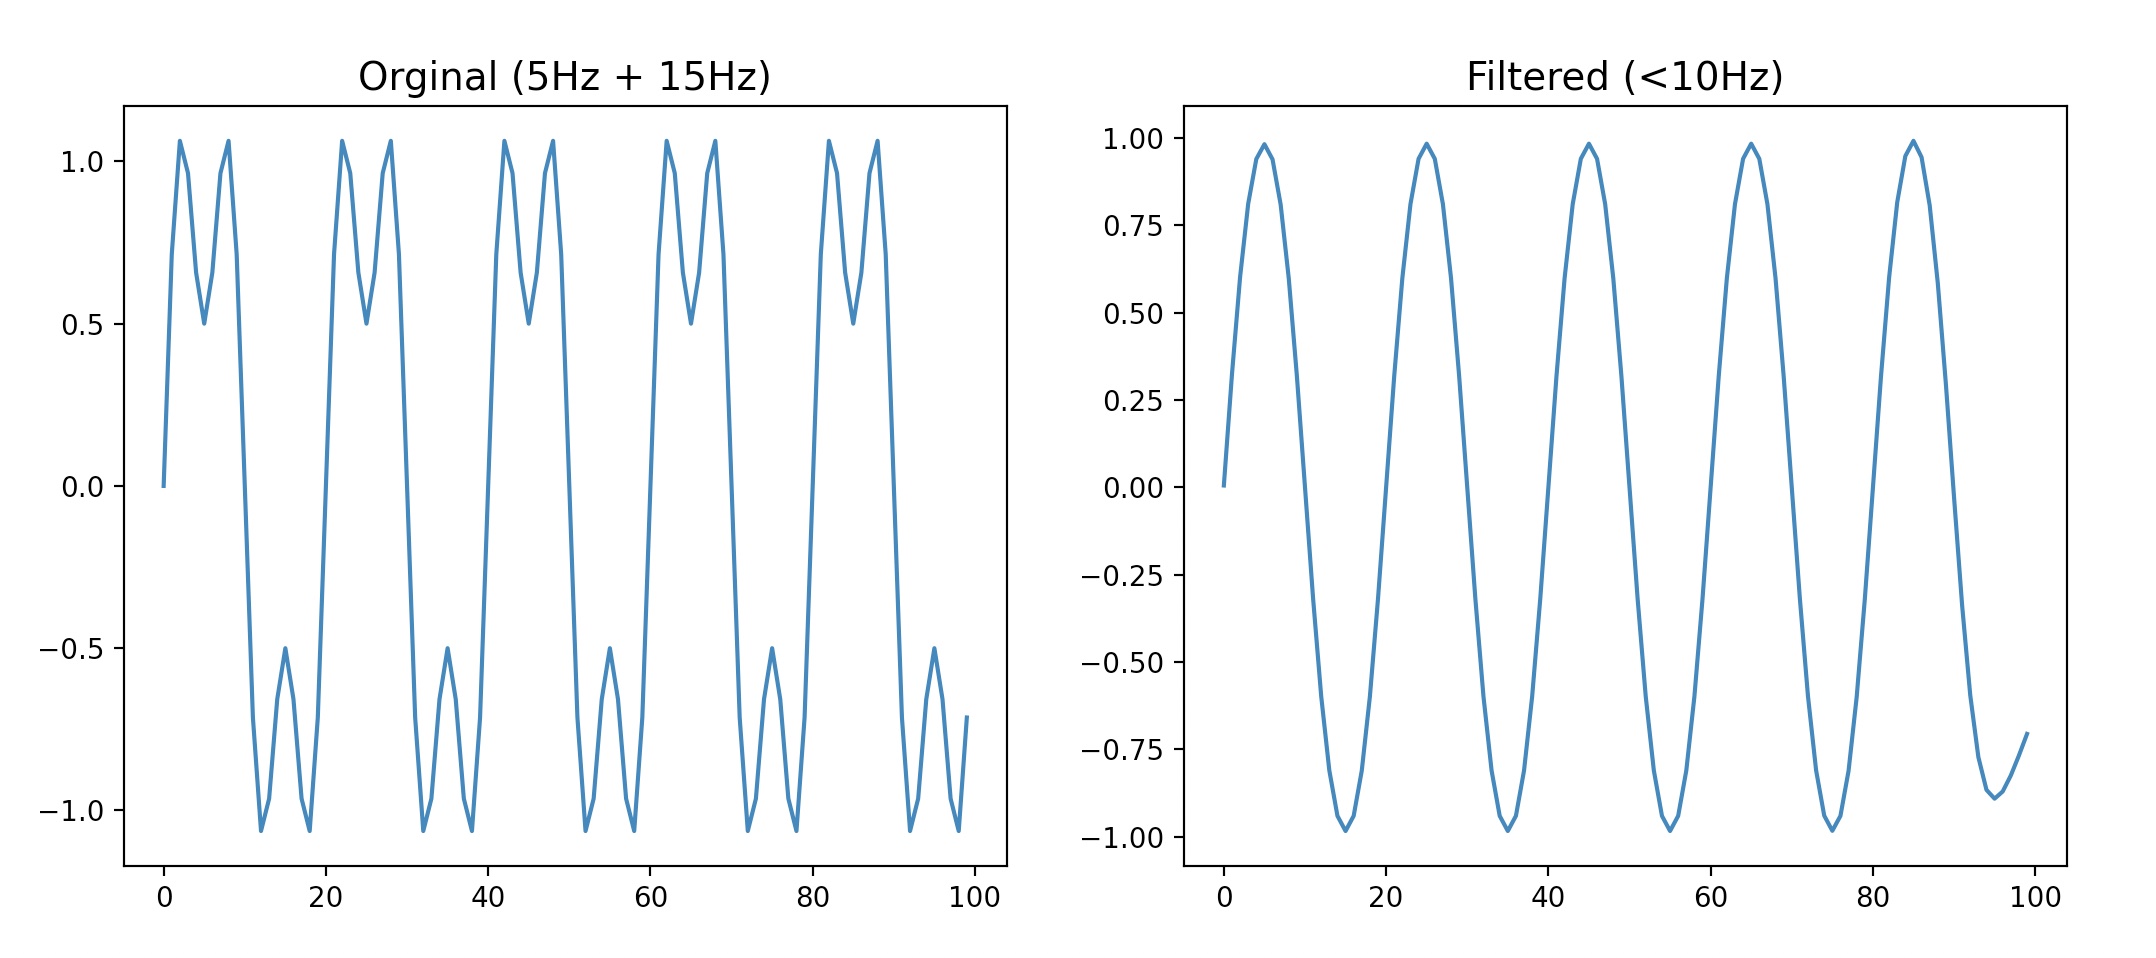
- 首先构造一个采样频率为 100Hz,由 20Hz 和 40Hz 正弦信号叠加起来的一维信号。
- 使用
Butterworth4 阶低通滤波器,通带截止频率为 30Hz 过滤信号。 - 得到原信号的低频部分。
1
2
3
4
5
6
7
8
9
10
11
12
13
14
15
16
17
18
19
20
21
22
23
import numpy as np
from matplotlib import pyplot as plt

from filter import Butterworth


if __name__ == '__main__':
    # original signal
    T = 1
    fs = 100
    x = np.linspace(0, T, num=fs*T, endpoint=False)
    signal = np.sin(2*np.pi*5*x) + 0.5 * np.sin(2*np.pi*15*x)
    # butterworth filter
    butterworth = Butterworth(fs, cut=10, mode='lowpass', order=4)
    filtered = butterworth.filt(signal)
    # show result
    plt.subplot(1, 2, 1)
    plt.plot(signal)
    plt.title('Orginal (5Hz + 15Hz)', fontsize=14)
    plt.subplot(1, 2, 2)
    plt.plot(filtered)
    plt.title('Filtered (<10Hz)', fontsize=14)
    plt.show()
滤波结果为:
